Tag: fortnite ecosystem health

  • Your Map Has 7 Days, But Not For the Reason You Think

    Your Map Has 7 Days, But Not For the Reason You Think

    Most Fortnite creators have heard some version of this warning: you have 7 days before the algorithm forgets you. Publish, spike, fade. That’s the assumed arc.

    The data tells a more interesting story.

    The First Week Is a Filter, Not a Finish Line

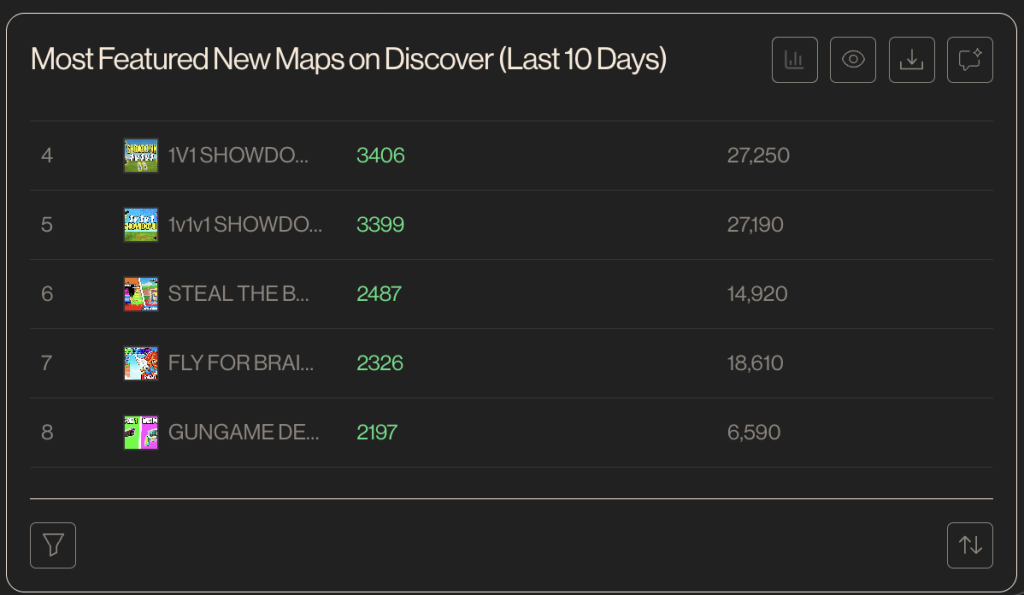
    Looking at featured map performance across the last 30 days, maps in their first 7 days average just 9.36 peak CCU. That sounds brutal — and for most maps, it is. But the maps that survive that window?

    They see a 440% jump in peak CCU in the following three weeks, averaging 50.55 by the 8–30 day mark.

    And the maps that make it past 30 days? They average 2,691 peak CCU — nearly 300x the week-one average — with over 3,100 average feature appearances.

    This isn’t a decay curve. It’s a funnel.

    The Survival Bias Effect

    Here’s why the numbers look the way they do: underperforming maps don’t stay in the featured rotation. They get abandoned by their creators, or deprioritised by the algorithm. What remains in the 8–30 day cohort is a self-selected group of maps that earned their place.

    In other words, the 440% growth isn’t magic. It’s what happens when only the sticky maps survive.

    The question isn’t “will my map last past 7 days?” The real question is: what does it take to be one of the maps that does?

    What the First Week Is Actually Measuring

    During launch, new maps enter a discovery spike — higher impressions, more experimental clicks, volatile retention. The algorithm is essentially testing your map on cold audiences.

    What it’s watching for isn’t raw CCU. Based on the data from Visceral’s featured map analysis, the metric that correlates most with sustained featuring is feature minutes — the total playtime your map generates while it’s in the discovery rotation.

    Maps that kept players longer got featured longer. And longer featuring creates more impressions, more players, more playtime. The feedback loop is self-reinforcing.

    This means the first 7 days isn’t about getting the highest spike. It’s about proving your map is worth keeping.

    The Chapter Launch Window: When the Door Opens Wide

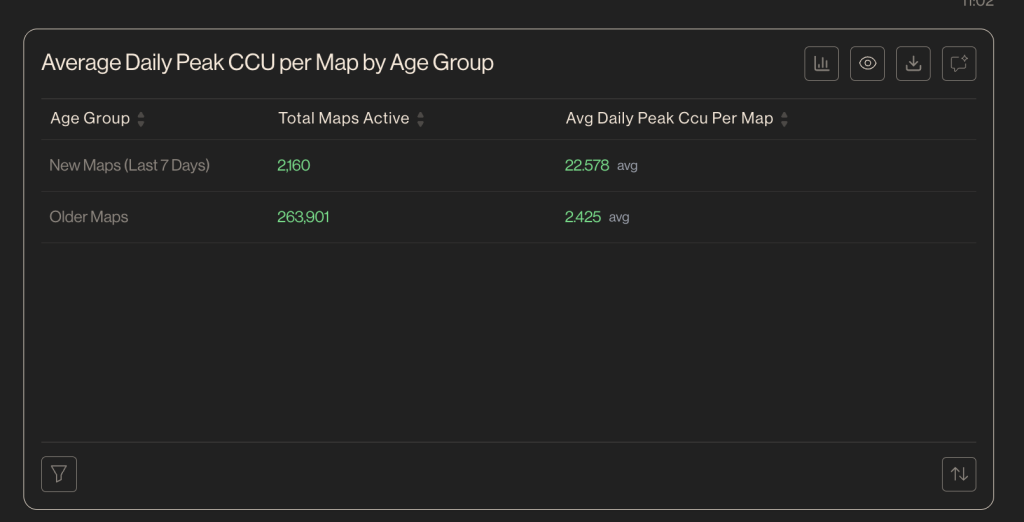
    Chapter launches are a special case. During the Chapter 7, Season 2 launch weekend, 143 new maps entered the Fortnite Top 100 across three days — roughly 40–58 new entries per day.

    New maps (under 7 days old) averaged 22.58 peak CCU during that period. Older maps averaged just 2.43. That’s an 89% engagement advantage for being new during a launch window.

    The discovery window isn’t fixed. Chapter launches, seasonal events, and algorithm shifts can expand it significantly. Creators who understand this can time their launches to coincide with moments when the platform is actively surfacing new content.

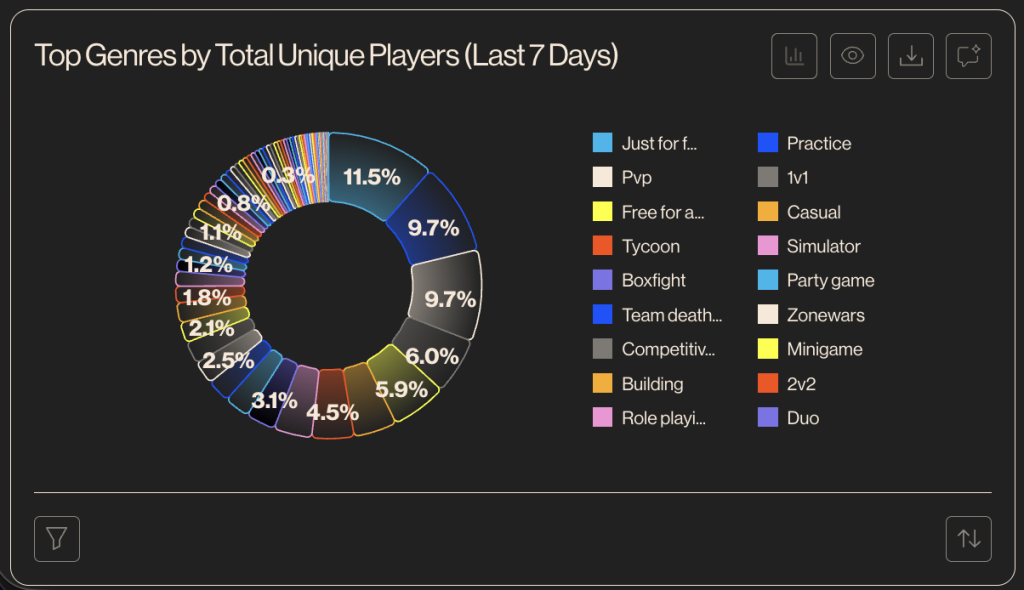
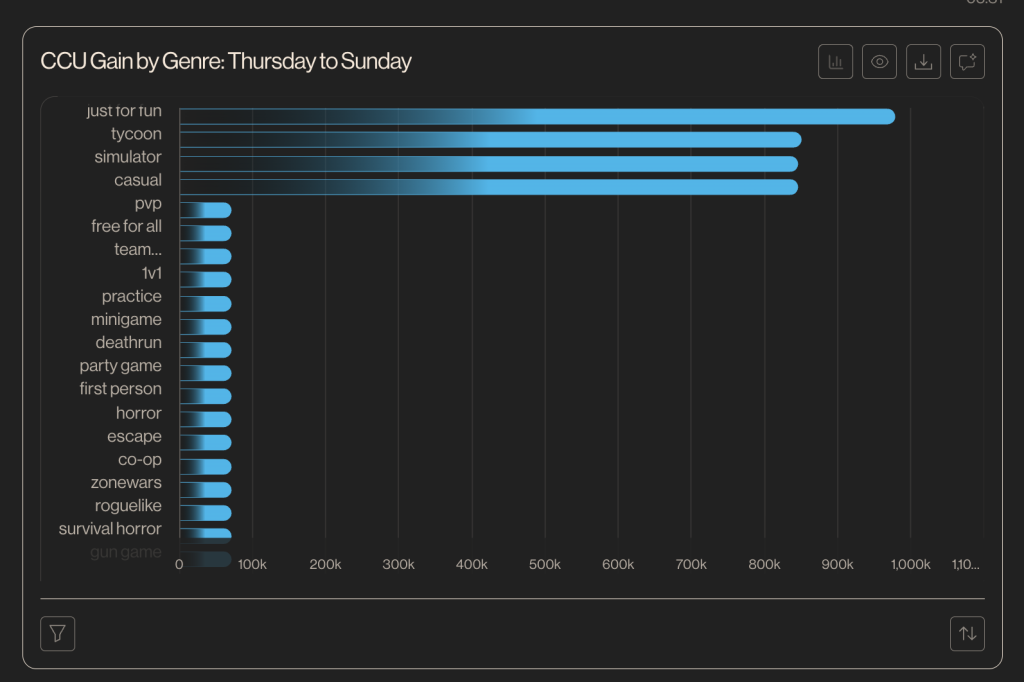
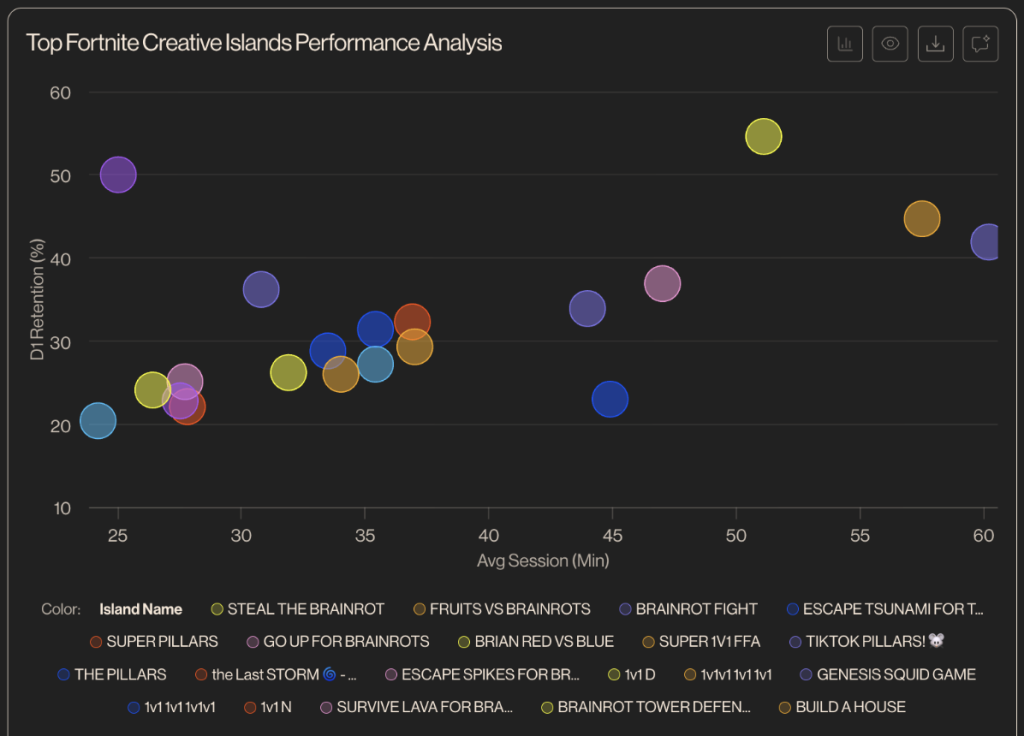
    Which Genres Survive Longest

    Not all maps age the same way. Looking at which genres generate the most sustained feature appearances, two patterns emerge.

    High-action genres like Simulator (~1,143 avg peak CCU) and Tycoon (~898 avg peak CCU) lead on raw player numbers. But niche categories like Choices Matter and Card Game stay featured 2–3x longer, averaging over 1,746 feature appearances. These genres have lower player volume but dramatically higher loyalty — players return, fatigue is low, and the algorithm keeps rewarding them.

    The takeaway: peak CCU and feature longevity aren’t the same thing. A smaller, deeply loyal audience can outlast a bigger, more casual one.

    What This Means for Creators

    If the first 7 days is a filter, your job during that window is to pass it. That means:

    Optimise for retention, not launch noise. A Day-1 spike that doesn’t convert to Day-2 play hurts your standing with the algorithm. Early retention signals are what extend your featuring window.

    Build for short loops, not long setups. The maps that pass the filter share a pattern: fast onboarding, repeatable gameplay, and sessions that players choose to extend — not ones they endure.

    Time your launch deliberately. Chapter launches, season starts, and event windows dramatically increase the volume of new maps getting surfaced. A strong map launched at the right moment gets substantially more discovery exposure than the same map launched on a quiet Tuesday.

    Don’t read week one as the final verdict. Maps at 9.36 average CCU in week one don’t look like hits. The ones that earned their way to 50+ by week four didn’t look like hits either — until they were.

    The Takeaway

    The 7-day window is real. But it’s not a deadline. It’s a test.

    The Fortnite algorithm is asking a simple question in those first seven days: do players come back? Maps that answer yes don’t fade. They compound.

    Your map’s first week isn’t about going viral. It’s about proving it’s worth keeping around.

    Want insights like this for your own map?

    Ask the Visceral AI chatbot anything. From retention benchmarks to Discover performance.
    Stop guessing and start optimizing with real Fortnite data.

  • Fortnite’s Health Check: Chaotic, Spiky and Very Much Alive

    Fortnite’s Health Check: Chaotic, Spiky and Very Much Alive

    If Fortnite were a patient, the diagnosis would read: erratic pulse, strong appetite, slightly addicted to novelty. In other words perfectly healthy for a live-service game in 2026.

    The Heartbeat Is Still Strong

    Daily unique users swing hard. From late February through March, the data shows two major spikes, one near ~19M on March 8 and another hitting ~21M around March 22 — before dropping back to a baseline of 5–8M. That’s not decline. That’s event-driven elasticity.

    Fortnite no longer behaves like a steady multiplayer game. It behaves like TikTok. Peaks come from moments, not routine. The ceiling remains high; getting there just requires a trigger.

    Battle Royale Still Pays the Bills

    The playtime gap is starker than most people realise. Battle Royale logged roughly 3,000M minutes in the last 7 days. The next closest, “Steal the Brainrot” sits at around 300–400M. Everything else barely registers on the same chart.

    Creative isn’t replacing BR; it’s orbiting it. The ecosystem is additive, not cannibalistic, at least for now.

    Discovery Is Powered by Spikes, Not Stability

    The week-over-week growth chart makes one thing immediately clear: “Secret red vs blue” grew approximately 6,000% in a single week. The runner-up, a 1v1v1 map, came in around 1,200%. After that, growth falls sharply.

    These aren’t slow burners. They’re viral bursts. Fortnite Discover behaves more like YouTube Shorts than a traditional game store — if you don’t pop fast, you don’t pop at all.

    Engagement Shows a Winner-Takes-Most Pattern

    The engagement scatter plot is almost comically lopsided. One map sits alone at roughly ~900K players with ~400K likes and recommends. Every other map clusters in the bottom-left corner, barely visible at scale.

    This is a textbook power-law distribution. Fortnite Discover isn’t crowded — it’s top-heavy. But that’s also what keeps the ecosystem exciting: a new map can still break through. It just has to break through hard.

    Genres: Chaos, Not Monoculture

    No single Creative genre dominates. “Just for Fun” leads with 11.5% of unique players, followed by PvP and Free-for-All at 9.7% each, then Tycoon (6.0%) and Boxfight (5.9%). The long tail continues through Team Deathmatch, Competitive, Building, and Roleplay — none individually significant.

    The largest slice being just 11.5% is a bullish signal for a platform this size. Players aren’t locked into one format, experimentation still works, and trends can shift quickly. Fortnite is less “one meta” and more controlled chaos.

    Featured Maps Reinforce the Viral Loop

    The most-featured new maps of the last 10 days tell a consistent story: 1V1 SHOWDOWN (3,406 features, 27,250 players), 1v1v1 SHOWDOWN (3,399 features, 27,190 players), STEAL THE BRAINROT (2,487 features, 14,920 players), FLY FOR BRAINROTS (2,326 features, 18,610 players).

    Short, competitive, repeatable. Epic is promoting fast entry, instant skill expression, and quick return loops, i.e. the same design logic that keeps social platforms sticky.

    So… Is Fortnite Healthy?

    Yes, but not in the traditional sense.

    Fortnite isn’t stable. It’s elastic. It spikes, rotates trends, redistributes attention, and lets new winners emerge. That’s messy, but it’s exactly what keeps a UGC platform alive. The 6,000% week-over-week surge on a single map isn’t an anomaly, it’s the product working as designed.

    The biggest takeaway: Fortnite no longer behaves like a game with modes. It behaves like a content platform with gravity.

    Battle Royale is the sun. Creative is the weather. Discover is the algorithm.

    And right now? The forecast is volatile with a high chance of growth.

    Want insights like this for your own map?

    Ask the Visceral AI chatbot anything. From retention benchmarks to Discover performance.
    Stop guessing and start optimizing with real Fortnite data.

  • Fortnite Chapter 7, Season 2 Launch Weekend Analysis

    Fortnite Chapter 7, Season 2 Launch Weekend Analysis

    New Fortnite chapters usually reset attention. This one didn’t just reset it, it scrambled it.

    Looking at Creative data from Thursday through Sunday, three things became clear: players explored more, competitive maps stalled, and meme-driven chaos dominated.

    Casual Chaos Took Over

    The biggest winner wasn’t PvP, practice, or competitive formats. It was “just for fun.”

    That genre alone added ~978,000 CCU, the largest gain across the board.
    Tycoon and simulator weren’t far behind, both adding ~845K CCU, but competitive formats barely moved.

    PvP, by comparison, gained only ~53K CCU.

    That’s not a small difference – it’s a structural shift. During chapter launches, players don’t want skill expression. They want frictionless chaos.

    Brainrot Went From Trend to Dominant Strategy

    The biggest single map growth belonged to GO UP FOR BRAINROTS, which gained 118,790 CCU – dwarfing the rest of the top 10.

    More telling: brainrot-themed maps made up 30% of the top 10 by raw growth and 60% of the top 10 by percentage growth.

    This isn’t just meme content performing well. It’s meme content defining the moment.

    Competitive staples like SUPER 1V1 FFA still grew, but in the 11–16K range, far behind the chaotic leaders.

    The Discovery Window Was Real and Brutal

    New maps (last 7 days) averaged 22.58 peak CCU, while older maps averaged just 2.43.
    That’s an ~89% engagement drop once a map ages out of the “new” window.

    Chapter launches amplify this effect. Players explore aggressively, and attention rotates quickly.

    Leaderboard churn confirms it:

    • 58 new entries on Friday
    • ~40 new entries per day across the weekend
    • 143 total new maps entering the Top 100

    In short: visibility was wide open but only briefly.

    Engagement Dipped, Then Stabilized

    Total Creative CCU actually fell ~67% compared to the previous four days, suggesting normalization after launch hype or broader player redistribution.

    But retention held relatively steady:

    • Thursday peak: 1,941
    • Friday dip: ~18% drop
    • Sunday recovery: 1,816

    Players didn’t stop playing, they spread out.

    What This Means

    This chapter launch didn’t reward depth. Epic reward immediacy.

    The winners shared three traits:

    • instant understanding
    • chaotic payoff loops
    • low skill barrier

    Meanwhile, competitive formats, which rely on mastery and repetition, struggled to capture exploratory traffic.

    The takeaway is simple:
    When Fortnite resets, players experiment.
    And when players experiment, chaos wins.

    This weekend, progression didn’t dominate. Skill didn’t dominate.
    Funny, fast, and slightly ridiculous did.

    Want insights like this for your own map?

    Ask the Visceral AI chatbot anything. From retention benchmarks to Discover performance.
    Stop guessing and start optimizing with real Fortnite data.

  • The State of Fortnite Creative: What the Data Says About the Ecosystem in Q1 2026

    The State of Fortnite Creative: What the Data Says About the Ecosystem in Q1 2026

    Fortnite Creative has evolved into a massive creator economy, but the distribution of success inside the ecosystem is far from equal.

    Using Visceral.io ecosystem data across top-performing creator-made islands, a clear pattern emerges: a handful of breakout experiences capture the majority of player attention, while the rest of the market competes in a long tail of smaller audiences.

    Enter Prompt: “What are the top Fortnite Creative maps in the last 3 months based on D1 Retention and Average Session time”

    A Hit-Driven Economy

    The most striking signal in the data is how concentrated player traffic is. One island – STEAL THE BRAINROT – reached a peak of 1,083,892 concurrent players, capturing significantly more traffic than the rest of the top Creative islands combined.

    This reflects a classic power-law distribution seen across creator platforms like YouTube, Roblox, and Steam. A small number of hits dominate attention, while thousands of smaller experiences compete for discovery. For creators, this means the difference between a good map and a breakout hit is enormous.

    Retention Drives Success

    If peak CCU shows acquisition power, retention reveals the real engine behind successful islands. Two of the strongest performers in the dataset – STEAL THE BRAINROT and SUPER 1V1 FFA – both achieve over 50% Day-1 retention, meaning more than half of players return the following day.

    Across the top Creative islands:
    Average session length: 36.9 minutes
    Mean peak CCU: 78,980 players

    These numbers highlight an important pattern: maps that keep players engaged for longer sessions tend to generate stronger repeat play and sustained traffic.

    The Rise of Simulator and Tycoon Formats

    When we look at genres driving the strongest engagement metrics, Simulator and Tycoon maps stand out clearly.

    These progression-driven experiences are producing:

    • Peak CCU in the tens or hundreds of thousands
    • Average session lengths exceeding 45 minutes

    Unlike traditional PvP formats, these maps rely on progression loops, upgrades, and resource accumulation, creating longer play sessions and stronger player investment.
    This structure mirrors the mechanics that have long powered Roblox’s most successful games.

    Competitive Maps Follow a Different Pattern

    Not every successful island relies on long progression loops. Low barrier competitive formats, especially 1v1 and free-for-all maps, behave differently.

    Maps like SUPER 1V1 FFA generate:

    • Shorter sessions
    • High replay frequency
    • Extremely strong Day-1 retention

    Rather than holding players for long sessions, these maps succeed by encouraging quick repeat matches and habitual play.
    In other words, Creative is now supporting two different engagement models:

    1. Progression Worlds – Long sessions, Tycoon / simulator loops, Deep player investment
    2. Competitive Arenas – Short sessions, Fast match cycles, High replay frequency

    Both formats can succeed but they rely on very different player behaviours.

    What This Means for Creators

    The data suggests three clear signals for builders in the Fortnite ecosystem:

    1. Hits dominate the market
      The majority of player traffic concentrates around a small number of breakout islands.
    2. Retention matters more than novelty
      Experiences that bring players back the next day consistently outperform those that rely purely on initial discovery spikes.
    3. Progression systems are driving engagement
      Simulator and tycoon mechanics are currently the strongest structure for sustaining long play sessions.

    Fortnite Creative is no longer just a collection of minigames. It’s evolving into a full creator economy where retention systems, progression loops, and player psychology increasingly determine which experiences break out.
    And as the ecosystem continues to grow, understanding the data behind those patterns will only become more important for creators hoping to build the next breakout island.

    Want insights like this for your own map?

    Ask the Visceral AI chatbot anything. From retention benchmarks to Discover performance.
    Stop guessing and start optimizing with real Fortnite data.